mmcbrien
GitHub Commits
| Title | SHA |
|---|---|
Back to Thoughts
Interactive K Nearest Neighbors
May 21, 2023
KNN Overview
K Nearest Neighbors (KNN) is a simple machine learning algorithm that can be used for classification. It is one of the easiest to explain and understand and requires no complicated math.
K Nearest Neighbors classifies an observation by assuming that other data points that are most similar
to the provided observation will indicate the class. The process works by first finding the K
closest data points to the provided observation. It then makes a vote from these neighbors using a majority
vote. If more than 50% of the neighbors belong to a class, then the observation is classified as that
class. If no single class constitutes more than 50% of the nearest neighbors, the observation is considered
undetermined by the algorithm.
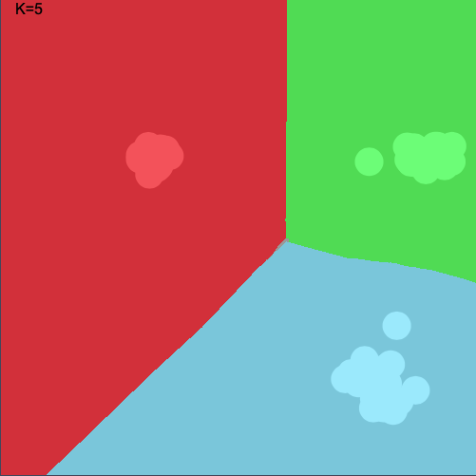
KNN can be visualized quite easily. Imagine we have three classes - Red, Green, and Blue. Now imagine our input
data contains two continuous values. If we have two continuous values, we can plot these in two dimensions. The
following image shows a visualization of KNN. The circles are the provided data points and are colored according
to their class. The background color indicates how that point would be classified by KNN. The value of K is 5
in this case.
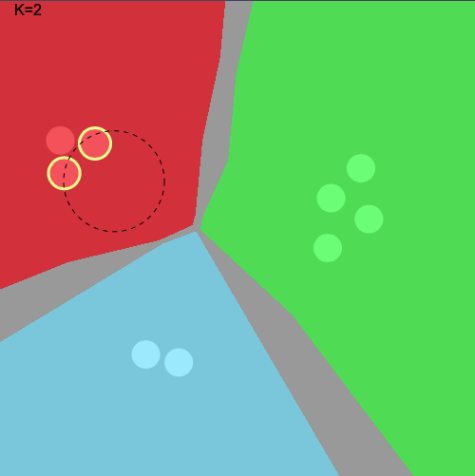
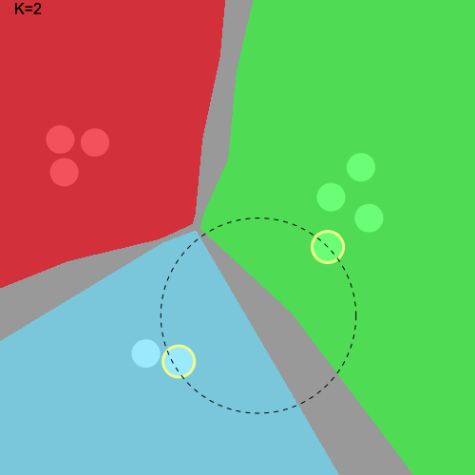
The following charts visualize how the voting system works more clearly. In this case, K is set to 2. For the first
image, we see that the point is classified as the Red class because the two nearest neighbors are both Red. In the
second case, the two nearest neighbors are Green and Blue. Since no single class constitutes > 50%, this point cannot
be classified – so is colored as grey.
 |
 |
KNN can handle any number of features, but if we have more than two, the visualization breaks down.
To calculate the “nearest neighbors”, the algorithm must calculate the distance between data points. In this article, the euclidean distance is used. So the distance between two datapoints $x_1$ and $x_2$ would be the following, where $d$ is the number of features in the dataset:
\[\text{distance}(x_1, x_2) = \sqrt{\sum_{i=1}^d(x_{1i} - x_{2i})^2}\]Or for a dataset with just two features:
\[\text{distance}(x_1, x_2) = \sqrt{(x_{11} - x_{21})^2 + (x_{12} - x_{22})^2}\]Interactive KNN
The nodes in the following can be moved by clicking on them and then clicking on a destination. This will update our input data and the region will be reclassified. You can click on any point in the region to see which neighbors are nearest, which helps with visualizing why a point is classified as it is.
The value of K is 2.
Challenge: can you reorganize the data points in such a way that no point in the region can be classified due to ties in the KNN algorithm?